 BGS Data Catalogue
Tomography
Type of resources
Topics
Keywords
Contact for the resource
Provided by
Years
Formats
Representation types
Update frequencies
-

Table S1.xlsx is Table S1, which contains 2D measurements of cell clusters used in Fig. 5 (this is also available from the publisher's website). The folders SMNH X 4447, SMNH X 5331 and SMNH X 5357 contain data from X-ray tomographic analyses of fossils figured in the paper: For SMNH X 5331 (the conical fossil that is the focus of the paper) there are two zip archives: 1. Slice data and Avizo files, containing: - Slice data: the raw scan data (.tif image stack) - Label files for cell clusters and individual cells: Avizo projects (.hx) containing the labels and the files required to open the project file. The cluster labels are based on a downsampled version of the data which is included here as slice data (.tif image stack). Voxel sizes for this file are 0.325 x 1.3 x 0.325 micrometers. 2. Working files, containing: - Surface models: .ply files for clusters and individual cells. - Segmented stacks: the label files as .tif stacks (voxel sizes as per slice data: 0.325 x 0.325 x 0.325 micrometres (cell labels); 0.325 x 1.3 x 0.325 micrometers (cluster labels)). SMNH X 4447 and SMNH X 5357 (two specimens figured for comparison) there is: - Slice data: zip archives of the raw scan data (.tif image stack). The individual slices (.tif images) can be viewed with standard graphics software, and the datasets can be studied in 3D using tomographic reconstruction software such as Avizo (www.vsg3d.com/), Spiers (www.spiers-software.org/), VG Studio Max (www.volumegraphics.com) etc. The Avizo project and label files (.hx and .am files) require Avizo software (www.vsg3d.com/) to be opened. The 3D models (.ply files) are widely compatible with 3D freeware packages such as MeshLab (http://meshlab.sourceforge.net/) or Blender (https://www.blender.org/), or with proprietary software, e.g. Avizo (www.vsg3d.com/), Geomagic (http://www.geomagic.com/en/), Mimics (http://biomedical.materialise.com/mimics). The files relate to the following publication: Cunningham, J. A., Vargas, K., Marone, F., Bengtson, S. & Donoghue, P. C. J. 2016. A multicellular organism with embedded cell clusters from the Ediacaran Weng'an biota (Doushantuo Formation, South China). Evolution & Development
-

The data are from X-ray tomographic analyses of tubular fossils. All scans were carried out using Synchrotron Radiation X-ray Tomographic Microscopy (SRXTM) except for specimen SMNH X 5324 which was also analysed using Ptychographic X-ray Computed Tomography (PXCT). The methods are described in the paper. The data consist of a stacked series of .tif files that represent maps of X-ray attenuation. The individual slices can be viewed with standard graphics software. The datasets can be studied in 3D using tomographic reconstruction software such as Avizo (www.vsg3d.com/), Spiers (www.spiers-software.org/), VG Studio Max (www.volumegraphics.com) etc. The voxel size, which is needed for scale calculations, varies between datasets and is given below. Some datasets consist of two 'blocks' of data, with slices named [specimen name]_B1 and [specimen name]_B2. These are placed in the same folder and follow on directly from one another. They can be opened together as a single dataset. The files relate to the following publication: Cunningham, J. A., Vargas, K., Liu, P., Belivanova, V., Marone, F., Martinez-Perez, C., Guizar-Sicairos, M., Holler, M., Bengtson, S. & Donoghue, P. C. J. 2015. Critical appraisal of tubular putative eumetazoans from the Ediacaran Weng'an Doushantuo biota. Proceedings of the Royal Society Series B: Biological Sciences.
-

This dataset contains three dimensional synchrotron x-ray tomographic (SRXTM) datasets and analyses of nuclei and nucleoli in embryo-like fossils from the Ediacaran Weng'an Biota. The data accompanies the following paper: Yin Z, Cunningham JA, Vargas K, Bengtson S, Zhu M, Donoghue PCJ. 2017. Nuclei and nucleoli in embryo-like fossils from the Ediacaran Weng'an Biota. Precambrian Research. DOI: 10.1016/j.precamres.2017.08.009 Each .7z archive zip file contains the data relating to a single specimen.
-
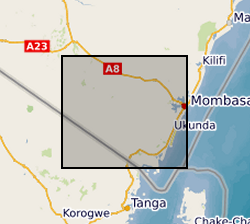
Results of Electrical Resistivity Tomography (ERT) conducted in Kwale County, Kenya December 2015 and June 2016 by University of Nairobi and Water Resources Management Authority as part of the Gro for GooD project (https://upgro.org/consortium/gro-for-good/) to characterize the aquifers in the study area. There were eight transects of length 1.2 to 6km, running W-E and NNE-SSW parallel to coastline. ERT data was analysed using RES2D inversion software. Gro for GooD - Groundwater Risk Management for Growth and Development
-

X-ray CT scan dataset of Darley Dale sandstone sample tts6. This sample was deformed in a true triaxial apparatus, and is fully described in the PhD thesis of Stuart (1992, UCL). The sample is a cube, measuring approximately 50 mm on a side. The sample experienced two sets of true triaxial deformation (test DDSS0009 and DDSS0010), with different applied stresses in the 1, 2 and 3 directions. This deformation produced distinct families of brittle microcracks, which were detected using acoustic emissions and seismic velocity analysis. This X-ray CT scan dataset was collected in 2019 at the University of Aberdeen by Dr Stewart Chalmers and Dr Dave Healy.
-

H2 adsorption data on sub-bituminous coal as a function of pressure. Hydrogen flooding of a coal core. Micro CT imaging of the effect on coal swelling after hydrogen injection. Hydrogen is trapped, and no swelling is observed indicating that coal might be a good candidate for the storage of hydrogen.
-

The images in this dataset are a sample of Ketton carbonate from a micro-computed tomography (micro-CT) scan acquired with a voxel resolution of 4.52 µm. This dataset is part of a study on the effects of Voxel Resolution in a study of flow in porous media. A brief overview of this study summarised from Shah et al 2015 follows. A fundamental understanding of flow in porous media at the pore-scale is necessary to be able to upscale average displacement processes from core to reservoir scale. The study of fluid flow in porous media at the pore-scale consists of two key procedures: Imaging reconstruction of three-dimensional (3D) pore space images; and modelling such as with single and two-phase flow simulations with Lattice-Boltzmann (LB) or Pore-Network (PN) Modelling. Here we analyse pore-scale results to predict petrophysical properties such as porosity, single phase permeability and multi-phase properties at different length scales. The fundamental issue is to understand the image resolution dependency of transport properties, in order to up-scale the flow physics from pore to core scale.
-

The datasets contains two sets of three dimensional images of Ketton carbonate core of size 5 mm in diameter and 11 mm in length scanned at 7.97µm voxel resolution using Versa XRM-500 X-ray Microscope. The first set includes 3D dataset of dry (reference) Ketton carbonate. The second set includes 3D dataset of reacted Ketton carbonate using hydrochloric acid.
-

The datasets contain 416 time-resolved synchrotron X-ray micro-tomographic images (grey-scale and segmented) of multiphase (brine-oil) fluid flow in a carbonate rock sample at reservoir conditions. The tomographic images were acquired at a voxel-resolution of 3.28 µm and time-resolution of 38 s. The data were collected at beamline I13 of Diamond Light Source, U.K., with an aim of investigating pore-scale processes during immiscible fluid displacement under a capillary-controlled flow regime, which lead to the trapping of a non-wetting fluid in a permeable rock. Understanding the pore-scale dynamics is important in many natural and industrial processes such as water infiltration in soils, oil recovery from reservoir rocks, geo-sequestration of supercritical CO2 to address global warming, and subsurface non-aqueous phase liquid contaminant transport. Further details of the sample preparation and fluid injection strategy can be found in Singh et al. (2017). These time-resolved tomographic images can be used for validating various pore-scale displacement models such as direct simulations, pore-network and neural network models, as well as to investigate flow mechanisms related to the displacement and trapping of the non-wetting phase in the pore space.
-
Reconstructed data - This dataset contains the reconstructed image data. Each sub-folder contains a set of 2D slices that together make up a 3D image from that time point. Not all images from all datasets have been reconstructed, the values in parentheses refer to the scan numbers that have been reconstructed. Raw data - This dataset contains the raw unprocessed image data collected during the development of the XRheo system. Processed data - This dataset contains the post-processing outputs from analysis of the data from the XRheo development experiments. Each sub-folder contains the files generated during filtering, segmentation and separation of the features [M (melt), B (bubbles), X (crystals)], and the post processing analysis for size distributions and tracking. The data sets included are the results of dynamic X-ray tomography experiments performed on multiphase synthesised magmas being deformed under known temperature and strain rates for a concentric cylinder geometry.