Porosity
Type of resources
Topics
Keywords
Contact for the resource
Provided by
Years
Formats
Representation types
Update frequencies
Scale
-
The images in this dataset are a sample of Bentheimer Sandstone from a micro-computed tomography (micro-CT) scan acquired with a voxel resolution of 6.00µm. We imaged the steady state flow of brine and decane in Bentheimer sandstone. We devised an experimental method based on differential imaging to examine how flow rate impacts the pore-scale distribution of fluids during coinjection. This allows us to elucidate flow regimes (connected, or breakup of the nonwetting phase pathways) for a range of fractional flows at two capillary numbers, Ca, namely 3.0E-7 and 7.5E-6. At the lower Ca, for a fixed fractional flow, the two phases appear to flow in connected unchanging subnetworks of the pore space, consistent with conventional theory. At the higher Ca, we observed that a significant fraction of the pore space contained sometimes oil and sometimes brine during the 1 h scan: this intermittent occupancy, which was interpreted as regions of the pore space that contained both fluid phases for some time, is necessary to explain the flow and dynamic connectivity of the oil phase; pathways of always oil-filled portions of the void space did not span the core. This phase was segmented from the differential image between the 30 wt % KI brine image and the scans taken at each fractional flow. Using the grey scale histogram distribution of the raw images, the oil proportion in the intermittent phase was calculated. The pressure drops at each fractional flow at low and high flow rates were measured by high precision differential pressure sensors. The relative permeabilities and fractional flow obtained by our experiment at the mm-scale compare well with data from the literature on cm-scale samples.
-
Data used for the peer-reviewed manuscript entitled 'Variation of hydraulic properties due to dynamic fracture damage: Implications for fault zones' by Aben, FM, Doan, M-L, and Mitchell, TM. Manuscript currently in revision for Journal of Geophysical Research. Data consists of: Text files with the mechanical data timeseries (confining pressure, and pore volume and pore fluid pressure for two pore fluid pressure intensifiers) obtained during permeability measurements of deformed rock samples. File name contains sample number. Additional two mechanical data files (calib15 and calib18) are calibration files for the pore volume measurements. Manually traced X-ray CT images obtained on six samples.
-
P* data obtained through hydrostatic loading experiments, using triaxial experimental apparatus, as well as yield curve data obtained through differential loading tests, prior to the discovery of P* for different synthetic sandstones. The methodology used was taken from Bedford et al. (2018, 2019). Grain size analysis data obtained using a Beckman Coulter LS 13 320 laser diffraction particle size analyser. Particle analysis was conducted on five different synthetic sandstones with different grain size distributions. Secondary electron and backscatter electron SEM images for natural and synthetic sandstones. Secondary electron images were stitched together to form a whole core image. They were then binarised following the methodology of Rabbani and Ayatollahi. (2015). Hexagon grid size data used to obtain the correct grid size for performing porosity analysis across an mage using Fiji software (Brown, 2000). Bedford, J. D., Faulkner, D. R., Leclère, H., & Wheeler, J. (2018). High-Resolution Mapping of Yield Curve Shape and Evolution for Porous Rock: The Effect of Inelastic Compaction on 476 Porous Bassanite. Journal of Geophysical Research: Solid Earth, 123(2), 1217–1234. Bedford, J. D., Faulkner, D. R., Wheeler, J., & Leclère, H. (2019). High-resolution mapping of yield curve shape and evolution for high porosity sandstone. Journal of Geophysical Research: Solid Earth. Brown, G. O., Hsieh, H. T., & Lucero, D. A. (2000). Evaluation of laboratory dolomite core sample size using representative elementary volume concepts. Water Resources Research, 36(5), 484 1199–1207. Rabbani, A., & Ayatollahi, S. (2015). Comparing three image processing algorithms to estimate the grain-size distribution of porous rocks from binary 2D images and sensitivity analysis of the grain overlapping degree. Special Topics & Reviews in Porous Media: An International Journal, 6(1).
-
The data include the following: 1. Simulation input files (parameters used in free energy Lattice Boltzmann simulations). 2. Results from these simulations and the corresponding analysis, as presented in the manuscript "Pore scale modeling of drainage displacement patterns in association with geological sequestration of CO2". Free energy lattice Boltzmann method: A thermodynamically consistent numerical scheme to solve the hydrodynamic equations of motion, associated with two-phase flow at the pore-scale. Simulations were accelerated by using multiple general-purpose graphics processing units (GPGPUs).
-
This data is described in section 6.4 of the following paper, Three-Field Block Preconditioners for Models of Coupled Magma/Mantle Dynamics by Rhebergen et al DOI:10.1137/14099718X
-
The images in this dataset show the mixing of two liquid solutions in a random bead pack as a function of time and in three-dimensions. The working fluids used in this study are solutions of methanol and ethylene-glycol (MEG, fluid 1) and brine (fluid 2). In particular, three mixtures of ethylene-glycol and methanol were prepared that differ in wt% ethylene-glycol, namely 55 wt% (MEG55), 57 wt% (MEG57) and 59 wt% (MEG59). Measurements are conducted using in the regime of Rayleigh numbers, Ra = 2000-5000. X-ray Computed Tomography is applied to image the spatial and temporal evolution of the solute plume non -invasively. The tomograms are used to compute macroscopic quantities including the rate of dissolution and horizontally averaged concentration profiles, and enable the visualisation of the ow patterns that arise upon mixing at a spatial resolution of about (2x2x2) mm3. We observe that the mixing process evolves systematically through three stages, starting from pure diffusion, followed by convection-dominated and shutdown. A modified diffusion equation is applied to model the convective process with an onset time of convection that compares favourably with literature data and an effective diffusion coefficient that is almost two orders of magnitude larger than the molecular diffusivity of the solute. The comparison of the experimental observations of convective mixing against their numerical counterparts of the purely diffusive scenario enables the estimation of a non-dimensional convective mass flux in terms of the Sherwood number, Sh = 0.025Ra. We observe that the latter scales linearly with Ra, in agreement with observations from both experimental and numerical studies on thermal convection over the same Ra regime.
-
These data contain time series of stress, strain, confining pressure, pore pressure, pore volume, permeability and elastic wave velocities of samples of Purbeck Limestone deformed under hydrostatic and triaxial conditions at room temperature. All samples were saturated with decane as pore fluid.This dataset is used and fully described/interpreted in the paper: Brantut, N., M. Baker, L. N. Hansen and P. Baud, Microstructural control of physical properties during deformation of porous limestone, submitted to J. Geophys. Res.
-

A significant part of this data collection is geophysical survey data in digital form, being mainly instrumental recordings made during fieldwork. Derived data created during the subsequent processing and interpretation of the field data is described in 'Nirex Magnetic Tape Archives - Processed Data'. These data were originally stored on a variety of media. With the overall aim of delivering an efficient and effective archive service, the data have been consolidated onto DLT cartridges. Some related data, which were either analogue, on obscure media or in unknown formats have been retained in their original form. British Geological Survey maintains a full catalogue of the data, as an Access database.The data sets that comprise the magnetic archive are the following: Seismic surveys: marine, land and transition zone; field, navigation, statiatcs; Geophysical wireline logging of boreholes: routine wireline logging of investigation boreholes (gamma-ray, sonic, porosity, etc.); velocity surveys; dipmeter surveys;vertical seismic profiling; borehole televiewer (BHTV) surveys; formation microscanner (FMS) surveys; Ground surveys: magnetic; gravity; radiometric; thermal imaging; photographic imaging; in-flight videos. The ownership of NIREX (Nuclear Industry Radioactive Waste Executive) was transferred from the nuclear industry to the UK Government departments DEFRA and DTI in April 2005, and then to the UK's Nuclear Decommissioning Authority (NDA) in November 2006.
-
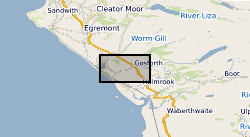
A significant part of this data collection is geophysical survey data in digital form being derived data created during the subsequent processing and interpretation of the field data described in 'Nirex Magnetic Tape Archives - Raw Data'. These data were originally stored on a variety of media. With the overall aim of delivering an efficient and effective archive service, the data have been consolidated onto DLT cartridges. Some related data, which were either analogue, on obscure media or in unknown formats have been retained in their original form. British Geological Survey maintains a full catalogue of the data, as an Access database. The data sets that comprise the magnetic archive are the following: Seismic surveys: demultiplexed and processed data; Geophysical wireline logging of boreholes: wireline derived data including synthetic seismograms; cross-hole tomography. The ownership of NIREX (Nuclear Industry Radioactive Waste Executive) was transferred from the nuclear industry to the UK Government departments DEFRA and DTI in April 2005, and then to the UK's Nuclear Decommissioning Authority (NDA) in November 2006.
-

These images were acquired using micro computed tomographic imaging of 7 sandstone plugs taken at various depths in the Sellafield borehole 13B. SF696 (63.8 m), SF697 (76.1 m), SF698 (96.98 m), SF699 (126.27 m), SF700 (144.03 m), SF701 (172.16 m) and SF702 (181.39 m). These samples are further detailed and analysed in the following article: http://dx.doi.org/10.1144/petgeo2020-092
 BGS Data Catalogue