 BGS Data Catalogue
2017
Type of resources
Topics
Keywords
Contact for the resource
Provided by
Years
Formats
Representation types
Update frequencies
Scale
-
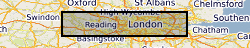
The BGS GeoSure Shrink Swell 3D data is a regional hazard susceptibility map that identifies areas of potential shrink–swell hazard, in three dimensional space, at intervals down to 20m in the London and Thames Valley area. Shrinking and swelling clays can change volume due to variation in moisture, which can cause ground movement that may affect many foundations. The data provides an indication of variation in Volume Change Potential (VCP) of shrink-swell clays and is classified on an A-E (low to high) range of hazard susceptibility. BGS GeoSure Shrink Swell 3D for London is part of the BGS GeoSure range of natural subsidence products. It is derived from the BGS Geology 50k data, the BGS London Lithoframe 3D model and the GeoSure v7 Shrink-Swell layer.
-
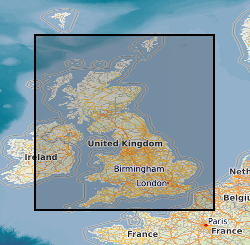
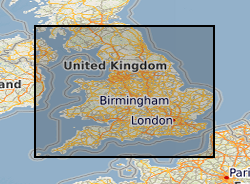
The 5km Hex GS Landslides dataset shows a generalised view of the GeoSure Landslides v7 dataset to a hexagonal grid resolution of 64.95km coverage area (side length of 5km). This dataset indicates areas of potential ground movement in a helpful and user-friendly format. The rating is based on a highest level of susceptibility identified within that Hex area: Low (1), Moderate (2), Significant (3). Areas of localised significant rating are also indicated. The summarising process via spatial statistics at this scale may lead to under or over estimation of the extent of a hazard. The supporting GeoSure reports can help inform planning decisions and indicate causes of subsidence. The methodology is based on the BGS Digital Map (DiGMapGB-50) and expert knowledge of the behaviour of the formations so defined. This dataset provides an assessment of slope instability. Landslide hazard occurs due to particular slope characteristics (such as geology, gradient, sources of water, drainage, man-made constructions) combining to cause the slope to become unstable. Downslope movement of materials, such as a landslide or rockfall may lead to a loss of support and damage to buildings. Complete Great Britain national coverage is available.
-

The 5km Hex GS Soluble Rocks dataset shows a generalised view of the GeoSure Soluble Rocks v7 dataset to a hexagonal grid resolution of 64.95km coverage area (side length of 5km). This dataset indicates areas of potential ground movement in a helpful and user-friendly format. The rating is based on a highest level of susceptibility identified within that Hex area: Low (1), Moderate (2), Significant (3). Areas of localised significant rating are also indicated. The summarising process via spatial statistics at this scale may lead to under or over estimation of the extent of a hazard. The supporting GeoSure reports can help inform planning decisions and indicate causes of subsidence. The Soluble Rocks methodology is based on the BGS Digital Map (DiGMapGB-50) and expert knowledge of the behaviour of the formations so defined. This dataset provides an assessment of the potential for dissolution within a geological deposit. Ground dissolution occurs when certain types of rock contain layers of material that may dissolve if they get wet. This can cause underground cavities to develop. These cavities reduce support to the ground above and can lead to a collapse of overlying rocks. Dissolution of soluble rocks produces landforms and features collectively known as 'karst'. Britain has four main types of soluble or 'karstic' rocks; limestone, chalk, gypsum and salt, each with a different character and associated potential hazards. Engineering problems associated with these karstic rocks include subsidence, sinkhole formation, uneven rock-head and reduced rock-mass strength. Sinkhole formation and subsidence has the potential to cause damage to buildings and infrastructure. Complete Great Britain national coverage is available.
-
The Environment Agency has updated its groundwater vulnerability map to reflect improvements in data mapping, modelling capability and understanding of the factors affecting vulnerability. Two new maps are available which show the vulnerability of groundwater to a pollutant discharged at ground level. The potential impact of groundwater pollution is considered using the aquifer designation status which provides an indication of the scale and importance of groundwater for potable water supply and/or in supporting baseflow to rivers, lakes and wetlands. This dataset has shared IP (Intellectual Property) between Environment Agency and British Geological Survey. It supersedes the previous Groundwater Vulnerability 100k data released by EA.
-
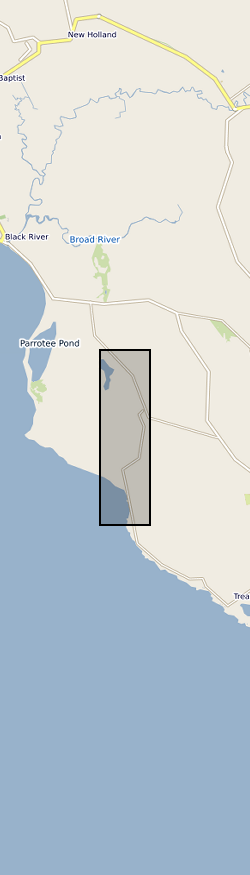
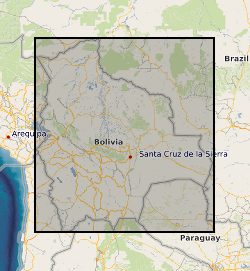
Surface waters and shallow groundwater samples were collected by completely filling 30 mL polyethylene bottles, which were then sealed with electrical tape to minimise the risk of evaporative loss. Rainwater samples were integrated samples of total monthly rainfall collected in a specially-adapted rainfall collector following IAEA protocols (IAEA http://www-naweb.iaea.org/napc/ih/documents/userupdate/sampling.pdf [accessed 22 June 2012). Stable isotopes of oxygen and hydrogen were determined simultaneously using a 'Picarro' WS-CRDS system at the University of Liverpool or the University of Cambridge. Jamaica, Parish of St Elizabeth. Wallywash Great Pond (lat: 17.9716°; long: -77.8068°) (lake water and groundwater samples) and Pon de Rock Guest House (lat: 17.9156°; long: -77.7973°) (rainwater samples). Refer to accompanying map for the precise location of the lake water sampling sites
-

Global warming during the Palaeocene-Eocene Thermal Maximum (PETM, ~56 Ma) is commonly interpreted as being driven by massive destabilization of carbon from surficial sedimentary reservoirs. If correct, this has important implications for the amplification of future fossil fuel emissions via carbon-climate feedbacks. In our study we provided new paired records of boron and carbon isotope changes in the ocean that questions this long-held interpretation. Our data are implemented in an Earth system model to reconstruct the unfolding carbon cycle dynamics across the event. Strong evidence for a larger (>10,000 PgC) and on average isotopically heavier (> -17‰) carbon source leads us to identify volcanism associated with the North Atlantic Igneous Province as the main driver of the PETM. We also find that although organic carbon feedbacks with climate played a more minor role in driving the event than previously thought, organic matter burial was important in ultimately sequestering this carbon and driving the recovery of the system. Data presented in this data set comprise geochemical elemental, as well as boron, carbon and oxygen isotopic data from surface dwelling foraminifera Morozovella Subbotina. Alongside the boron isotopic data we also provide reconstructed surface water pH with corresponding uncertainties for our preferred pH reconstruction.
-

Geochemical and isotopic data presented here cover the Paleocene-Eocene Thermal Maximum (~56 Ma ago) and were produced to assess the degree of carbon cycle perturbations, ocean acidification and the origin of the emitted carbon added to the atmosphere-ocean system during this major carbon cycle perturbation event. For further details on the analytical approach please refer to the original publication (Gutjahr et al., 2017, Nature). Data contained within the two tables comprise foraminiferal carbonate based stable boron, carbon and oxygen isotopic results from DSDP Site 401 located within the Bay of Biscaye in the NE Atlantic (Table 1). This table also contains B/Ca, Mg/Ca and Al/Ca data from the same samples. Depth in core is presented alongside two alternative relative age models setting ages in relation to the Carbon Isotope Excursion observed during the Paleocene Eocene Thermal Maximum. Table 2 contains high-resolution bulk carbonate stable carbon and oxygen isotopic results that were produced to establish a new age models for this core.
-
These files contain Electric Resistivity Ground Imaging (ERGI) data measured using a Tigre 128 electric resistivity system with 64 electrodes in a roll-along survey mode. The electrodes were spaced 5 m apart and used in a Wenner a array configuration. The format of the file names is as follows: The two digits following B (18 or 20) is a label indicating the measurement site The digit following the T (1, 2 or 3) is the measurement transect number The next six digits, following the underscore, are the measurement date (ddmmyy) The next two digits, following the second underscore, are the survey number (measurements were repeated multiple times) The files are in tab delimited ascii text format, with three columns of data: Column 1 contains the distance measured across the survey transect Column 2 contains the a-spacing (the distance between adjacent electrode pairs) in m Column 3 contains the measured apparent resistivity value in Ohm m
-

Each contains two columns of data representing the UTM coordinates of the centre line of the Rio Beni in Bolivia. These coordinates were derived by digitising Landsat imagery and aerial photographs (1960 only). The number in the file name after "banks_c" corresponds to the year. Numbers in column 1: UTM Zone 19S Easting Numbers in column 2: UTM Zone 19S Northing
-
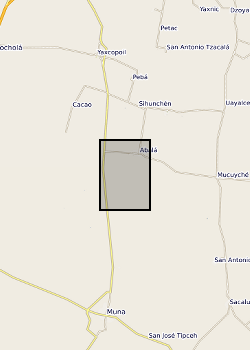
Surface waters and shallow groundwater samples were collected by completely filling 30 mL polyethylene bottles, which were then sealed with electrical tape to minimise the risk of evaporative loss. Rainwater samples were integrated samples of total monthly rainfall collected in a specially-adapted rainfall collector following IAEA protocols (IAEA http://www-naweb.iaea.org/napc/ih/documents/userupdate/sampling.pdf [accessed 22 June 2012). Mexico, State of Yucatan. Yaal Chac (lake) (lake centre is Lat: 20.595274 degrees; Long: -89.711301 degrees), Abala Well (Lat: 20.649044 degrees; Long: -89.679814 degrees) and Xanil ha Cave (Lat: 20.650809 degrees; Long: -89.697426 degrees) Rainwater sampler was located adjacent to the lake. Refer to accompanying map for the precise location of the sampling sites.