 BGS Data Catalogue
Bacteria
Type of resources
Topics
Keywords
Contact for the resource
Provided by
Years
Formats
Representation types
Update frequencies
-

Two sediment depth cores were collected from a mud sediment patch at the sea floor of the Irish Sea. Cores were collected by the University of Manchester. Cores were sliced at 1 cm intervals from 0 - 10 cm, and at 2 cm intervals thereafter. Slicing was performed in an anaerobic bag. Samples were transferred to Newcastle University for DNA extraction. A total of 21 samples were extracted for core 1, and 23 samples extracted for core 2.
-

Two sediment depth cores were collected from the floor of Loch Etive, near Oban, Scotland. Slicing was performed in an anaerobic bag. Samples were taken at 0.5 cm increment between 0 - 2 cm, 1 cm increments between 2 - 10 cm, and at either 2 or 5 cm increments thereafter. Samples were transferred to Newcastle University for DNA extraction. A total of 21 samples were extracted for core 1, and 23 samples extracted for core 2.
-

Soil depth core collected from the Needle’s Eye site in Dumfries, Scotland. Clear plastic depth core was lowered into a bog within the site, excised, and capped at the top and bottom. Core was sliced at 1 cm intervals at the University of Manchester in an anaerobic bag. A total of 41 samples were generated. Soil samples were returned to Newcastle University.
-
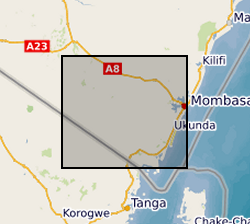
Results of microbial water quality conducted in Kwale County, Kenya from 2015 to 2017 by University of Oxford and Universitat Politecnica de Catalunya as part of the Gro for GooD project (https://upgro.org/consortium/gro-for-good/). Water samples from 101 locations (including 31 open wells, 27 deep boreholes, 21 shallow boreholes with handpumps, 15 covered dug wells with handpumps, and 10 surface water sites. This data set contains results for microbial risk parameters including Escherichia coli, thermotolerant coliforms (TTCs) and tryptophan-like fluorescence (TLF). Most samples also have accompanying data on pH, conductivity, water temperature and turbidity. Duplicate and replicate samples are included and indicated by 'Dup' or 'Rep'. Duplicates samples were collected from the same water points within minutes of each other and laboratory replicates were different aliquots from a single sample. Risk classifications of E. coli and TTC data are based on the World Health Organisation's microbial water quality risk grading scheme. Manufacturer recommended sampling protocols were used. The sampled water points were in regular use and boreholes were flushed with either an electric pump or hand-pumping prior to sample collection. Samples from the open wells were drawn with buckets and rope, which were designated for each site and were rinsed prior to sampling to minimise secondary contamination. Daily field and laboratory blank samples were analysed to confirm no secondary contamination or cross-contamination between sites. For the tryptophan-like fluorescence (TLF) measurement, approximately three litres of unfiltered water were pumped or poured into a stainless-steel container (kept in a black box to prevent ambient light from interfering). The container was cleaned with ethanol and triple-rinsed with sample water prior to each measurement. Measurement was conducted for approximately 3 minutes and the median result was used. The probe and its sensor window were kept clean. Air bubble formation on the sensor window was avoided. For the bacteria sampling, sterile purpose-made bags were used for sample collection and immediately stored in a cooler box with ice-packs. They were transported and processed to begin incubation within two to five hours. Gro for GooD: Groundwater Risk Management for Growth and Development
-

Data consist of field spectral reflectance measurements and surface photographs of cyanobacterial soil crusts and other surficial materials in Diamantina National Park, Queensland. Data were collected as part of project NE/K011626/1 (associated with NE/K011464/1) Multiscale Impacts of Cyanobacterial Crusts on Landscape Stability. The reflectance data and associated surface photographs are of biological and physical soil crusts developed on claypan and sand dune surfaces alongside the Diamantina River (specifically on and around Lake Constance pan and Homestead pan. Data were collected and processed by Kevin White and Ian Davenport, using a Spectra Vista Hr1024i spectrometer with a spectralon reference panel. All data were processed using SVC Hr1024i PC Data acquisition software (version 1.6.7 Beta) to remove areas of spectral overlap. Photographs taken using a range of mobile device cameras. All field photographs are in JPEG (jpg) format. Data were collected for the purpose of assessing the ability to remotely sense presence/absence of cyanobacterial soil crusts for mapping purposes. Data are organised into a directory structure based on specific field experiments, each with its own directory structure. Dataset 1: Calcrete Reflectance Spectra, Diamantina National Park. Calcrete exposures are common in Diamantina National Park, forming flat-topped hills known locally as 'Jump-Ups'. Calcretes creat false positives with the commonly used biological soil crust indices from remote sensing data, so field spectra of calcretes were collected to characterise their spectral reflectance to assist with image processing. Dataset 2: Lake Constance Pan Mapping project Field Photographs, Reflectance Spectra and field notes, Lake Constance Clay Pan, Diamantina National Park. This dataset is a repeat survey undertaken in 2015, which revisited sample points first surveyed as part of the so-called 'MAM survey' in 2000. Dataset 3: Solar Radiation Photosynthesis experiment Field Photographs and Reflectance Spectra from three locations in Diamantina National Park, Lake Constance pan, a duneflank site on ‘Crusty Inlet dune’ (where no photosynthesis could be stimulated) and Homestead pan. The Homestead pan experiment was run twice (Winter 2015 and Summer 2016). Dataset 4: Shade netting experiment Spectral Reflectance measurements of a spectralon panel were taken under the shade netting to characterise the transmissivity of the netting at different solar elevation angles. Dataset 5: Photographic cards Spectral reflectance measurements of a set of photographic reference cards, which were included in the frame of all the surface photographs collected for this project. Dataset 6: Mobile Device experiment Field Photographs taken with a range of mobile device cameras (Moto G, Nexus 6 and Samsung Galaxy Note 10.1) and two cameras (Nikon Coolpix P610 and Nikon Coolpix 950 Full Spectrum), and associated reflectance spectra data, for 5 study sites Crusty Inlet Pan Surface, Crusty Inlet Dune North Flank, Lake Constance Pan and Homestead Dune. Dataset 7: Rainfall simulator Spectral reflectance data and associated field notes of sites used in a rainfall simulator/wind tunnel experiment, Lake Constance claypan (which formed part of the associated NERC project NE/K011464/1)
-
Data from laboratory experiments conducted as part of project NE/K011464/1 (associated with NE/K011626/1) Multiscale Impacts of Cyanobacterial Crusts on Landscape stability. Soils were collected from two sites in eastern Australia and transferred to a laboratory at Griffith University, Queensland for conduct of experiments. Soils were A, a sandy loam, and B a loamy fine sand. Trays 120 mm x 1200 mm x 50 mm were filled with untreated soil that contained a natural population of biota. Soils were either used immediately for experiments (physical soil crust only: PC) or were placed in a greenhouse and spray irrigated until a cyanobacterial crust has grown from the natural biota. Growth was for a period of 5 days (SS), c.30 days (MS2) or c.60 days (MS1). Following the growing period (if applicable) trays were placed in a temperature/humidity controlled room at 35° and 30% humidity until soil moisture (measured 5 mm below the surface) was 5%. Trays were then subject to rainfall simulation. Rainfall intensity of 60 mm hr-1 was used and rainfall was applied for 2 minutes (achieving 2 mm application), 8 minutes (achieving 8 mm application) or 15 minutes (achieving 15 mm application). Following rainfall, trays were returned to the temperature/humidity-controlled room under UV lighting until soil moisture at 5 mm below the surface was 5%. A wind tunnel was then placed on top of each tray in turn and a sequential series of wind velocities (5, 7, 8.5, 10, 12 m s-1) applied each for one minute duration. On each tray the five wind velocities were run without saltation providing a cumulative dust flux. For the highest wind speed, an additional simulation run was conducted with the injection of saltation sands. Three replicates of each rainfall treatment were made. Variables measured include photographs, spectral reflectance, surface roughness, fluorescence, penetrometry, chlorophyll content, extracellular polysaccharide content, Carbon, Nitrogen and splash erosion and particle-size analysis (of wind eroded material). Details of rainfall simulator, growth of cyanobacteria, laser soil surface roughness characterisation and wind tunnel design and deployment in Strong et al., 2016; Bullard et al. 2018, 2019. Bullard, J.E., Ockelford, A., Strong, C.L., Aubault, H. 2018a. Impact of multi-day rainfall events on surface roughness and physical crusting of very fine soils. Geoderma, 313, 181-192. doi: 10.1016/j.geoderma.2017.10.038. Bullard, J.E., Ockelford, A., Strong, C.L., Aubault, H. 2018b. Effects of cyanobacterial soil crusts on surface roughness and splash erosion. Journal of Geophysical Research – Biogeosciences. doi: 10.1029/2018. Strong, C.S., Leys, J.F., Raupach, M.R., Bullard, J.E., Aubault, H.A., Butler, H.J., McTainsh, G.H. 2016. Development and testing of a micro wind tunnel for on-site wind erosion simulations. Environmental Fluid Mechanics, 16, 1065-1083.
-

Data from laboratory experiments conducted as part of project NE/K011464/1 (associated with NE/K011626/1) Multiscale Impacts of Cyanobacterial Crusts on Landscape stability. Soils were collected from two sites in eastern Australia and transferred to a laboratory at Griffith University, Queensland for conduct of experiments. Soils were A, a sandy loam, and B a loamy fine sand. Trays 120 mm x 1200 mm x 50 mm were filled with untreated soil that contained a natural population of biota. Soils were either used immediately for experiments (physical soil crust only: PC) or were placed in a greenhouse and spray irrigated until a cyanobacterial crust has grown from the natural biota. Growth was for a period of 5 days (SS), c.30 days (MS2) or c.60 days (MS1). Following the growing period (if applicable) trays were placed in a temperature/humidity controlled room at 35º and 30% humidity until soil moisture (measured 5 mm below the surface) was 5%. Trays were then subject to rainfall simulation. Rainfall intensity of 60 mm hr-1 was used and rainfall was applied for 2 minutes (achieving 2 mm application), 8 minutes (achieving 8 mm application) or 15 minutes (achieving 15 mm application). Following rainfall, trays were returned to the temperature/humidity-controlled room under UV lighting until soil moisture at 5 mm below the surface was 5%. A wind tunnel was then placed on top of each tray in turn and a sequential series of wind velocities (5, 7, 8.5, 10, 12 m s-1) applied each for one minute duration. On each tray the five wind velocities were run without saltation providing a cumulative dust flux. For the highest wind speed, an additional simulation run was conducted with the injection of saltation sands. Three replicates of each rainfall treatment were made. Variables measured include photographs, spectral reflectance, surface roughness, fluorescence, penetrometry, chlorophyll content, extracellular polysaccharide content, Carbon, Nitrogen and splash erosion and particle-size analysis (of wind eroded material). Details of rainfall simulator, growth of cyanobacteria, laser soil surface roughness characterisation and wind tunnel design and deployment in Strong et al., 2016; Bullard et al. 2018, 2019. Bullard, J.E., Ockelford, A., Strong, C.L., Aubault, H. 2018a. Impact of multi-day rainfall events on surface roughness and physical crusting of very fine soils. Geoderma, 313, 181-192. doi: 10.1016/j.geoderma.2017.10.038. Bullard, J.E., Ockelford, A., Strong, C.L., Aubault, H. 2018b. Effects of cyanobacterial soil crusts on surface roughness and splash erosion. Journal of Geophysical Research – Biogeosciences. doi: 10.1029/2018. Strong, C.S., Leys, J.F., Raupach, M.R., Bullard, J.E., Aubault, H.A., Butler, H.J., McTainsh, G.H. 2016. Development and testing of a micro wind tunnel for on-site wind erosion simulations. Environmental Fluid Mechanics, 16, 1065-1083.
-

Two sediment depth cores were collected from the River Esk estuary during low tide near the town of Ravenglass, UK. Cores were collected by the University of Manchester. Cores were sliced at 1 cm intervals from 0 - 10 cm, and at 2 cm intervals thereafter. Slicing was performed in an anaerobic bag. Samples were transferred to Newcastle University for DNA extraction. A total of 19 samples were extracted for core 1, and 18 samples extracted for core 2.
-

Soil depth core collected from the Needle’s Eye site in Dumfries, Scotland. Clear plastic depth core was lowered into a bog within the site, excised, and capped at the top and bottom. Core was sliced at 1 cm intervals at the University of Manchester in an anaerobic bag. A total of 42 samples were generated. Soil samples were returned to Newcastle University.
-
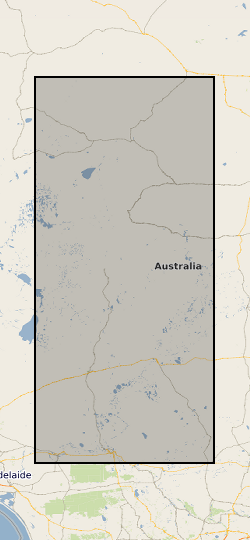
This dataset presents field measurements of the biological response of cyanobacterial soil crusts to rainfall and of the impact of this response on the susceptibility of the soil surface to wind erosion. The data are in Excel spreadsheets and record cyanobacteria fluorescence, the presence of chlorophyll a and exocellular polysaccharide, soil surface strength, particle size distribution and soil loss by wind erosion. The study was located within Diamantina National Park (23°36’44.8”S; 143°17’46.9”E) in the north-eastern part of the Lake Eyre basin, central Australia. Site characteristics are 1/A physical depositional crust; 2/B cyanobacterial crust on dune flank; 3/D cyanobacterial crust on claypan; 4/E physical structural crust; 5/C cyanobacterial crust on nebkha field. Different amounts of rainfall were applied using Griffith University Mobile Rainfall Simulator (see Bullard et al. 2018 for technical details). Following rainfall and drying in situ of the surface, wind erosion was measured using a portable mini-wind tunnel (see Strong et al. 2016 for technical details). The data will be of value for understanding cyanobacterial response to different rainfall amounts and wind speeds under future climate scenarios. The project principal investigator was Prof. Joanna Bullard and data Quality Assurance by Dr. Helene Aubault. Bullard, J.E., Ockelford, A., Strong, C.L., Aubault, H. 2018. Impact of multi-day rainfall events onsurface roughness and physical crusting of very fine soils. Geoderma, 313, 181-192. doi: 10.1016/j.geoderma.2017.10.038. Strong, C.L., Leys, J.F., Raupach, M.R., Bullard, J.E., Aubault, H.A., Butler, H.J., McTainsh, G.H. 2016. Development and testing of a micro-wind tunnel for on-site wind erosion simulations. Environmental Fluid Mechanics 16, 1065-1083.