 BGS Data Catalogue
Hydrogeology
Type of resources
Available actions
Topics
Keywords
Contact for the resource
Provided by
Years
Formats
Representation types
Update frequencies
Service types
Scale
-

Collection of data from the PhD Thesis 'Development of coupled processes numerical models of tracer, colloid and radionuclide tranpsort in field migration experiments', submitted as part of the RATE HydroFrame WP5. This collection of data includes blank model files in COMSOL Multiphysics and PHREEQC, as described in the PhD thesis. Also included in this data package are different spreadsheets with model outputs from the model files that describe the transport of conservative tracers, colloids and radionuclides in experiments carried out at the Grimsel Test Site, Switzerland as part of the Colloid Radionuclide and Retardation (CRR) and the Colloid Formation and Migration (CFM) experiments (www.grimsel.com).
-

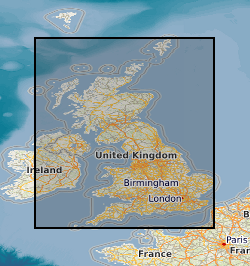
The data comprises a GIS layers representing the permeability of Superficial geological deposits for Great Britain. The permeability data has been derived from DiGMap-GB (Digital Geological Map Data of Great Britain), and therefore reflects the scale of DiGMap-GB. For the majority of the Great Britain, the scale is 1:50,000, however in areas where the geology is not mapped to this scale, the next best available scale, 1:625:000, is used. The data is updated annually, or after a major new release of DiGMap-GB. The permeability data describes the fresh water flow through geological deposits and the ability of a lithostratigraphical unit to transmit water. Maximum and minimum permeability indices are given for each geological unit to indicate the range in permeability likely to be encountered and the predominant flow mechanism (fracture or intergranular). Neither of the assigned values takes into account the thickness of either the unsaturated or saturated part of the lithostratigraphical unit. The data can be used freely internally, but is licensed for commercial use. It is best displayed using a desktop GIS, and is available in vector format as ESRI shapefiles and MapInfo TAB files.
-

The data comprises a GIS layer representing the permeability of bedrock for Great Britain The permeability data has been derived from DiGMap-GB (Digital Geological Map Data of Great Britain), and therefore reflects the scale of DiGMap-GB. For the majority of the Great Britain, the scale is 1:50,000, however in areas where the geology is not mapped to this scale, 1:250,000 data are. The data is updated annually, or after a major new release of DiGMap-GB. The permeability data describes the fresh water flow through geological deposits and the ability of a lithostratigraphical unit to transmit water. Maximum and minimum permeability indices are given for each geological unit to indicate the range in permeability likely to be encountered and the predominant flow mechanism (fracture or intergranular). Neither of the assigned values takes into account the thickness of either the unsaturated or saturated part of the lithostratigraphical unit. The data can be used freely internally, but is licensed for commercial use. It is best displayed using a desktop GIS, and is available in vector format as ESRI shapefiles and MapInfo TAB files.
-
The data comprises four GIS layers representing the permeability of geological deposits for Great Britain (bedrock, superficial, artificial and mass movement deposits). The permeability data has been derived from DiGMap-GB (Digital Geological Map Data of Great Britain), and therefore reflects the scale of DiGMap-GB. For the majority of the Great Britain, the scale is 1:50,000, however in areas where the geology is not mapped to this scale, the next best available scale is used. For bedrock deposits this is 1:250,000 and for superficial deposits this is 1:625:000. Artificial ground and mass movement deposits have not been mapped beyond 1:50,000. The data is updated annually, or after a major new release of DiGMap-GB. The permeability data describes the fresh water flow through geological deposits and the ability of a lithostratigraphical unit to transmit water. Maximum and minimum permeability indices are given for each geological unit to indicate the range in permeability likely to be encountered and the predominant flow mechanism (fracture or intergranular). Neither of the assigned values takes into account the thickness of either the unsaturated or saturated part of the lithostratigraphical unit. The data can be used freely internally, but is licensed for commercial use. It is best displayed using a desktop GIS, and is available in vector format as ESRI shapefiles and MapInfo TAB files.
-
These maps provide an overview, at the national scale, of the spatial relationships between principal aquifers and some of the major shale and clay units in England and Wales. The data comprises a series of occurrence maps shows the distribution of rock units that form the principal aquifers and some major shale and clay units in England and Wales. In addition, a series of separation maps show the vertical separation between pairs of shales or clays and overlying aquifers. If shale gas resources are to be developed in the UK, the implications for groundwater will need to be considered as part of any risk assessment. A step in such an assessment will be to understand and quantify the spatial relationships between the potential shale gas source rocks (including both shales and some clay units) and overlying aquifers. The datasets used to produce the aquifer maps, the shale and clay occurrence maps and the separation maps are available to download for your own use. As with other BGS data sets available for download, this will enable you to work offline to develop your own systems and methodologies using BGS data. The data used to produce the aquifer, shale and clay maps are available below as ESRI GIS and KML files.
-
The BGS Permeability Index dataset shows estimated rates of water movement from the ground surface to the water table. The v8 dataset incorporates the latest geology mapping (BGS Geology 50k). This includes updates to the lithology-coding schema, the LEX_RCS. A 2-part code used to identify the named rock unit from the BGS lexicon of named rock units (LEX) followed by a Rock Classification Scheme (RCS) code which describes the rocks lithological characteristics e.g. texture and composition. Updates to these codes and latest dissolution hazard data sourced from BGS GeoSure: Soluble Rocks have been reviewed and classified as part of the version 8 release. The dataset covers Great Britain and is presented at a scale of 1:50 000, based on the geological data at the same scale. However, in areas where the geology is not mapped to this scale, the next best available scale is used. The BGS Permeability Index can be used to compare the relative permeability of deposits at the regional scale, indicating where highly permeable rocks could allow rapid infiltration to occur, or where less permeable rocks are present and water could pond on the ground surface. The dataset can be used as a component in a wide range of geo-environmental assessments such as natural flood management, Sustainable Drainage Systems, engineering desk studies, slope stability, and aquifer vulnerability. It is for use at the regional scale and is not recommended for use at the site-specific scale.
-
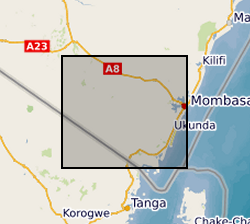
Results of Electrical Resistivity Tomography (ERT) conducted in Kwale County, Kenya December 2015 and June 2016 by University of Nairobi and Water Resources Management Authority as part of the Gro for GooD project (https://upgro.org/consortium/gro-for-good/) to characterize the aquifers in the study area. There were eight transects of length 1.2 to 6km, running W-E and NNE-SSW parallel to coastline. ERT data was analysed using RES2D inversion software. Gro for GooD - Groundwater Risk Management for Growth and Development
-
The data comprises GIS layers representing the permeability of mass movement deposits for Great Britain. The permeability data has been derived from DiGMap-GB (Digital Geological Map Data of Great Britain), and therefore reflects the scale of DiGMap-GB. For the majority of the Great Britain, the scale is 1:50,000,. The data is updated annually, or after a major new release of DiGMap-GB. The permeability data describes the fresh water flow through mass movement deposits and the ability of a unit to transmit water. Maximum and minimum permeability indices are given for each geological unit to indicate the range in permeability likely to be encountered and the predominant flow mechanism (fracture or intergranular). Neither of the assigned values takes into account the thickness of either the unsaturated or saturated part of the lithostratigraphical unit. The data can be used freely internally, but is licensed for commercial use. It is best displayed using a desktop GIS, and is available in vector format as ESRI shapefiles and MapInfo TAB files.
-
New acquisitions of all forms of geological data received from external organisations are recorded in the accessions database and the digital or analogue data itself is then available to users. Data is in the form of reports, plans and digital information. This information comes from a wide variety of sources, including public bodies and agencies and commercial organisations. The data itself will be incorporated into existing corporate collections or may form a new collection in its own right. The rate of transfer will depend on priorities and requirements of both internal and external users. Data is continuously removed from the collection, all except recently received material will have been processed.
-

This dataset was generated with a novel process-based stochastic modelling approach to investigate the productivity and sustainability of groundwater abstractions in the Precambrian basement aquifer in Ghana. The statistical distribution of the generated synthetic yield data was found in very good agreement with observed yield data from the same Ghanaian aquifer. The dataset includes more than 40,000 simulated values of maximum allowable yield and corresponding transmissivity values for different realisations of aquifer heterogeneity, net recharge values, and borehole depth. Further details about the dataset and the method of generation and collection can be found in the article by Bianchi et al. (2020) "Investigating the productivity and sustainability of weathered basement aquifers in tropical Africa using numerical simulation and global sensitivity analysis" published in the Water Resources Research journal. This research was supported by the UKRI British Geological Survey NC-ODA grant NE/R000069/1 and NE/M008827/1.