Granite
Type of resources
Topics
Keywords
Contact for the resource
Provided by
Years
Formats
Update frequencies
-
This dataset is used and fully described/interpreted in the paper: Passelegue, F. X., N. Brantut, T. M. Mitchell, Fault reactivation by fluid injection: Controls from stress state and injection rate, submitted to Geophys. Res. Lett. Text files contain raw and processed data. Mechanical data are raw. Load needs to corrected (offset) from piston friction, measured at the beginning of each run before the hit point. Axial displacement is converted into sample shortening by correcting the load from machine stiffness, which is equal to 480 kN/mm (calibrated on Mon. 14 Mar. 2016). Data include a set of elastic wave first arrival times, obtained from time of flight measurements using an array of piezoelectric transducers and the cross-correlation method detailed in Brantut (2015) (see reference above). Two separate files correspond to mechanical data from experiments conducted at 50 and 100 MPa confining pressure (""mech_Pc=???MPa.txt""). One file (""sensors.txt"") contains the initial positions of each piezoelectric transducer. Files named ""wave_?_Pc=100MPa.txt"" (?=1,2,3 or 4) contain time series of arrival times during the four injections conducted at Pc=100MPa. Each column consists in the time-of-flight between a given pair of sensors (x->y, where x is the index of source sensor, and y is the index of the receiver sensor, as per their numbering in the ""sensors.txt"" file.) In all the data files, the first column corresponds to a common time basis, in seconds.
-
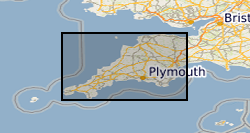
Publication and associated data from NERC Grant - NE/L001896/1. Published Paper, Andersen J, Stickland RJ, Rollinson GK, Shail RK. (2016) Indium mineralisation in SW England: Host parageneses and mineralogical relations. Ore Geology Reviews, volume 78, pages 213-238, DOI:10.1016/j.oregeorev.2016.02.019.
-
Data deposited are connected to paper "Investigating the use of 3-D full-waveform inversion to characterize the host rock at a geological disposal site" by H.L.M. Bentham, J.V. Morgan and D.A. Angus, in Geophysical Journal International, https://doi.org/10.1093/gji/ggy386. The geological model consists of fractured granite host rock (depth: 800 - 1200 m) with an Excavated disturbed Zone (EdZ) that could be formed through constructing the tunnels. In addition to the host rock, the model contains sedimentary overburden (depth: 0 - 800 m) and a fractured granite bed rock (depth: 1200 - 2000 m). Seismic velocities and rock properties were assigned through analogues e.g. Olkiluoto, Finland. Full data description and method found in Bentham et al. (2018). Data deposited are for Case 1 (no tunnels) and Case 3 (with multiple tunnels). For each case, the following 3D volumes are available: * Seismic data * True velocity model (used to generate seismic data) * Starting velocity model for full-waveform inversion Additionally, the following ASCII files are available to aid the use of the seismic and velocity models: * Locations of sources at surface (Case 1, 2 and 3 except where survey area is reduced [see GJI article]) * Locations of receivers at surface and below tunnels (Case 1, 2 and 3) * Locations of receiver at surface and above and below tunnels (Case 3 only)
-
This collection comprises two time-series of 3D in-situ synchrotron x-ray microtomography (μCT) volumes showing two Ailsa Craig micro-granite samples (ACfresh02 and ACHT01) undergoing triaxial deformation. These data were collected in-situ at the PSICHE beamline at the SOLEIL synchrotron, Gif-sur-Yvette, France in December 2016 (standard proposal 20160434) and are fully explained in Cartwright-Taylor A., Main, I.G., Butler, I.B., Fusseis, F., Flynn M. and King, A. (in press), Catastrophic failure: how and when? Insights from 4D in-situ x-ray micro-tomography, J. Geophys. Res. Solid Earth. Together, these two time-series show the influence of heterogeneity on the micro-crack network evolution. Ailsa Craig micro-granite is known for being virtually crack-free. One sample (ACfresh02) remained as-received from the quarry until it was deformed, while the second (ACHT01) was slowly heated to 600 degC and then slowly cooled prior to deformation in order to introduce material disorder in the form of a network of nano-scale thermal cracks. Thus these two samples represent two extreme end-members: (i) ACfresh02 with the lowest possible (to our knowledge) natural pre-existing crack density, and so is a relatively homogeneous sample and (ii) ACHT01 with a thermally-induced nano-crack network imprinted over the nominally crack-free microstructure, and therefore has increased heterogeneity relative to ACfresh02. Each 3D μCT volume shows the sub-region of each sample in which the majority of damage was located and has three parts. Part one is reconstructed 16-bit greyscale data. Part two is 8-bit binary data showing individual voids (pores and micro-cracks) in the dataset after segmentation. Part three is 32-bit data showing the local thickness of each void, as in Cartwright-Taylor et al. (in press) Figures 4 and 5. Each part is a zip file containing a sequence of 2D image files (.tif), sequentially numbered according to the depth (in pixels, parallel to the loading axis) at which it lies within the sample volume. File dimensions are in pixels (2D), with an edge length of 2.7 microns. Each zip file is labelled with the sample name, the relevant letter for each 3D volume as given in Cartwright-Taylor et al. (in press) Tables 3 and 4, part 1, 2 or 3 (depending whether the data are greyscale, binary or local thickness respectively), the differential stress (MPa) on the sample, and the associated ram pressure (bar) to link with individual file names. The following convention is used: sample_letter_part_differentialstress_rampressure_datatype. Also included are (i) two spreadsheets (.xlsx), one for each sample, containing processing parameters and the mechanical stress and strain at which each volume was scanned, and (ii) zip files containing .csv files containing measurement data for the labelled voids in each volume. N.B. void label numbers are not consistent between volumes so they can only be used to obtain global statistics, not to track individual voids.
-
Data recorded during hydrostatic pressurisation and triaxial rock deformation experiments of Westerly granite and Darley Dale sandstone. Data consists of mechanical data (load, displacement, confining pressure) and pore pressure data (up- and downstream pore pressure, upstream intensifier volume, four pore pressure transducers mounted on sample). Contains all data necessary to evaluate the results presented in the paper entitled: 'Fluid pressure heterogeneity during fluid flow in rocks: New laboratory measurement device and method' by Brantut and Aben, submitted to Geophysical Journal International, and available at arXiv (arXiv:2006.16699).
-
This data has been recorded during a triaxial rock deformation experiment where a Lanhelin granite samples was subjected to controlled shear failure. The data consists of mechanical data (load, displacement, confining pressure, strain gauge data) and acoustic data necessary to reproduce the seismic tomography presented in 'Rupture energetics in crustal rock from laboratory-scale seismic tomography' by Aben, Brantut, Mitchell and David [2019], Geophysical Research Letters. Acoustic data contains AE source locations and arrival times, sensor locations, arrival times of active acoustic surveys.
-
We undertook U-Pb analysis - both high precision ID-TIMS and high spatial resolution LA-MC-ICP-MS – to determine the age of the Wensleydale Granite. This was done in order to resolve the ambiguity surrounding an earlier (1974) Rb/Sr age determination.
-
Data has been recorded during triaxial rock deformation experiments where Lanhelin granite samples were subjected to dynamic and half-controlled shear failure. The data consists of mechanical data (load, displacement, confining pressure, strain gauge data), ultrasonic data (AE source locations and arrival times, sensor locations, arrival times of active acoustic surveys), and scanning electron microscope images of the samples after shear failure. Dataset contains all data necessary to evaluate the results presented in the paper entitled: 'Off-fault damage characterisation during and after experimental quasi-static and dynamic rupture in crystal rock from laboratory P-wave tomography and microstructures' by Aben, Brantut, and Mitchell, Journal of Geophysical Research: Solid Earth.
-
Data recorded during triaxial rock deformation experiments of Westerly granite in the presence of pressurised pore fluids (water). Data consists of mechanical data (load, displacement, confining pressure) and pore pressure data (up- and downstream pore pressure, upstream intensifier volume, four pore pressure transducers mounted on sample). Contains all data necessary to evaluate the results presented in the paper entitled: 'Dilatancy stabilises shear failure in rock' by Aben and Brantut, submitted to Earth and Planetary Science letters, and available at arXiv (arXiv:2101.10036).
-
Data recorded during triaxial rock deformation experiments of Westerly granite in the presence of pressurised pore fluids (water). Data consists of mechanical data (load, displacement, confining pressure) and pore pressure data (up- and downstream pore pressure, upstream intensifier volume, four pore pressure transducers mounted on sample) for two experiments, recorded at low and high acquisition frequencies. Also contains .h5 files with all ultrasonic waveforms (active surveys and acoustic emissions). Dataset complementary to dataset ID165485 . Contains all data necessary to evaluate the results presented in the paper entitled: 'Rupture and afterslip controlled by spontaneous local fluid flow in crustal rock' by Aben and Brantut, submitted to Geophysical Research Letters, and available at arXiv (arXiv:).
 BGS Data Catalogue