 BGS Data Catalogue
Aquifers
Type of resources
Available actions
Topics
Keywords
Contact for the resource
Provided by
Years
Formats
Representation types
Update frequencies
Service types
Scale
-

Matlab m-file code to generate a probabilistic model of aquifer-body occurrence in the subsurface of the Indo-Gangetic foreland basin, northwestern India. The accompanying ArcGIS ASCII matrix files give aquifer-body percentages in successive 10 m depth slices for use within the model. File xxx_01.txt is for depths 0-10 m, file xxx_02.txt for depths 10-20 m, etc.
-
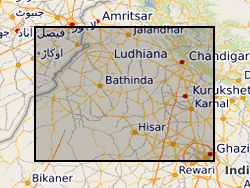
Thicknesses of aquifer units in the subsurface of the Indo-Gangetic foreland basin, northwestern India. Data are organised by borehole and indicate the thickness of aquifer units, separated by non-aquifer material.
-

Joint BGS/Environment Agency dataset of aquifer designations for England and Wales at 1:50 000. The dataset identifies different types of aquifer - underground layers of water-bearing permeable rock or drift deposits from which groundwater can be extracted. These designations reflect the importance of aquifers in terms of groundwater as a resource (drinking water supply) but also their role in supporting surface water flows and wetland ecosystems. The maps are split into two different type of aquifer designation: superficial - permeable unconsolidated (loose) deposits (for example, sands and gravels), and bedrock - solid permeable formations e.g. sandstone, chalk and limestone.
-
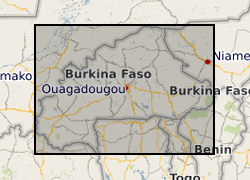
This dataset consists of reconstructions of daily groundwater levels for eight boreholes in Burkina Faso. Data for each borehole is provided in an individual csv file, with reconstructed groundwater level time series reported in metres above sea level (GWL, mASL). The groundwater level reconstructions were derived in 2019 as a part of the BRAVE project (NE/M008827/1 and NE/M008983/1) to develop an improved understanding of temporal variability in groundwater levels in sub-Saharan Africa. The reconstructions were derived using the lumped conceptual groundwater model AquiMod. Observed groundwater level time series for the eight boreholes were modelled using AquiMod, and the calibrated models were used with historic precipitation and potential evapotranspiration data to derive the reconstructions. The length of the time series of reconstructed groundwater levels varies between the boreholes due to differences in the length of the precipitation time series used to derive the reconstructions. Full details of this dataset are reported by Ascott et al. (2020). Ascott, M.J., Macdonald, D.M.J., Black, E., Verhoef, A., Nakohoun, P., Tirogo, J., Sandwidi, W.J.P., Bliefernicht, J., Sorensen, J.P.R., Bossa, A.Y., 2020. In Situ Observations and Lumped Parameter Model Reconstructions Reveal Intra-Annual to Multidecadal Variability in Groundwater Levels in Sub-Saharan Africa. Water Resour. Res., 56(12): e2020WR028056. DOI:https://doi.org/10.1029/2020WR028056
-

Digitised versions of a set of 1:100,000 scale maps of aquifer vulnerability for England and Wales. The dataset identifies the vulnerability to pollution of major and minor aquifers as defined by the Environment Agency, utilising a combination of geological, hydrogeological and soils data. The maps are designed to be used by planners, developers, consultants and regulatory bodies to ensure that developments conform to the Policy and Practice of the Environment Agency for the protection of Groundwater. Please note that these maps are based on data from the late 1980's and early 1990's, more up-to-date digital data may now be available from the Environment Agency. Flat maps may be purchased from the BGS, some sheets are now out of print.
-
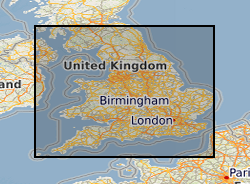
These maps provide an overview, at the national scale, of the spatial relationships between principal aquifers and some of the major shale and clay units in England and Wales. The data comprises a series of occurrence maps shows the distribution of rock units that form the principal aquifers and some major shale and clay units in England and Wales. In addition, a series of separation maps show the vertical separation between pairs of shales or clays and overlying aquifers. If shale gas resources are to be developed in the UK, the implications for groundwater will need to be considered as part of any risk assessment. A step in such an assessment will be to understand and quantify the spatial relationships between the potential shale gas source rocks (including both shales and some clay units) and overlying aquifers. The datasets used to produce the aquifer maps, the shale and clay occurrence maps and the separation maps are available to download for your own use. As with other BGS data sets available for download, this will enable you to work offline to develop your own systems and methodologies using BGS data. The data used to produce the aquifer, shale and clay maps are available below as ESRI GIS and KML files.
-
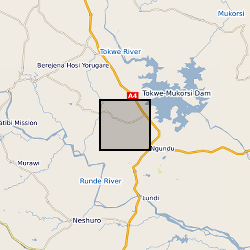
These files include hydrochemical data and groundwater level time series for a number of boreholes and wells within the basement aquifers of the Romwe catchment. For each borehole/well there are associated depth, geology and use data. A time series study of abstraction was also carried out for a subset of wells. Time series rainfall data for a rain gauge in the catchment is also included. These data were collected through a series of projects: Small scale irrigation using collector wells: pilot project (CEH/BGS/Zimbabwe Ministry of Lands, Agriculture and Water Development; DfID funded) Sustainability of yield from wells and boreholes in hard rock aquifers (BGS; DfID funded) Regional groundwater recharge assessment in semi-arid areas (CEH/BGS; DfID-funded) The Hydrology of a dry land catchment in southern Zimbabwe, and the effects of climatic and land use change on shallow groundwater resources (PhD project, Uni. Reading/CEH) Integrated Catchment Management and Sustainable Water Resource Development in Semi-arid Zimbabwe (PhD project, Uni. Reading/CEH) Note: CEH (Center of Ecology and Hydrology) was known as ‘IH’ during the period of the study
-
2 published papers from NERC grant NE/G016879/1. Palaeosol Control of Arsenic Pollution:The Bengal Basin in West Bengal, India by by U. Ghosal, P.K. Sikdar, and J.M. McArthur. Tracing recharge to aquifers beneath an Asian megacity with Cl/Br and stable isotopes: the example of Dhaka, Bangladesh by M. A. Hoque, J. M. McArthur, P. K. Sikdar, J. D. Ball and T. N. Molla (DOI 10.1007/s10040-014-1155-8)
-

This dataset was generated with a novel process-based stochastic modelling approach to investigate the productivity and sustainability of groundwater abstractions in the Precambrian basement aquifer in Ghana. The statistical distribution of the generated synthetic yield data was found in very good agreement with observed yield data from the same Ghanaian aquifer. The dataset includes more than 40,000 simulated values of maximum allowable yield and corresponding transmissivity values for different realisations of aquifer heterogeneity, net recharge values, and borehole depth. Further details about the dataset and the method of generation and collection can be found in the article by Bianchi et al. (2020) "Investigating the productivity and sustainability of weathered basement aquifers in tropical Africa using numerical simulation and global sensitivity analysis" published in the Water Resources Research journal. This research was supported by the UKRI British Geological Survey NC-ODA grant NE/R000069/1 and NE/M008827/1.
-
(I) Handpump Vibration Data For each handpump, data is organized in one CSV file per day. These files are grouped together over batches, where each batch approximately corresponds to three months. (II) Borehole Water Level Data Water level data at the borehole of each handpump is recorded in one CSV file per handpump. Both uncompensated (raw) and compensated (with respect to atmospheric pressure) data are available. (III) Data Time Logs A separate Excel file lists the locations of the monitoring sites and the time logs corresponding to both (I) and (II) per handpump. References: [1] P. Thomson, R. Hope, and T. Foster, “GSM-enabled remote monitoring of rural handpumps: a proof-of-concept study,” Journal of Hydroinformatics, vol. 14, no. 4, pp. 829–839, 05 2012. [Online]. Available: https://doi.org/10.2166/hydro.2012.183 [2] F. Colchester, “Smart handpumps: a preliminary data analysis,” IET Conference Proceedings, pp. 7–7(1). [Online]. Available: https://digital-library.theiet.org/content/conferences/10.1049/cp.2014.0767 [3] H. Greeff, A. Manandhar, P. Thomson, R. Hope, and D. A. Clifton, “Distributed inference condition monitoring system for rural infrastructure in the developing world,” IEEE Sensors Journal, vol. 19, no. 5, pp.1820–1828, March 2019. [4] F. E. Colchester, H. G. Marais, P. Thomson, R. Hope, and D. A. Clifton, “Accidental infrastructure for groundwater monitoring in africa,” Environmental Modelling Software, vol. 91, pp. 241 – 250, 2017. [Online]. Available:http://www.sciencedirect.com/science/article/pii/S1364815216308325 [5] A. Manandhar, H. Greeff, P. Thomson, R. Hope, and D. A. Clifton, “Shallow Aquifer Monitoring Using Handpump Vibration Data,” In-review, 2019.